New York City Mayor’s Office of Operations (Ops) is a charter that works with City agencies to collect and report data that aid in assessing agency performance. Every year they release the Mayor’s Management Report, made up of hundreds of pages of data from each agency. Ops sought to create a user-friendly platform that would make performance data more accessible and easier to understand for City agencies, elected officials, media, and the general public.
To satisfy the objectives laid out by Ops, the platform needed to be able to handle thousands of Key Performance Indicators (KPIs) from over 50 agencies, going back more than 20 years.
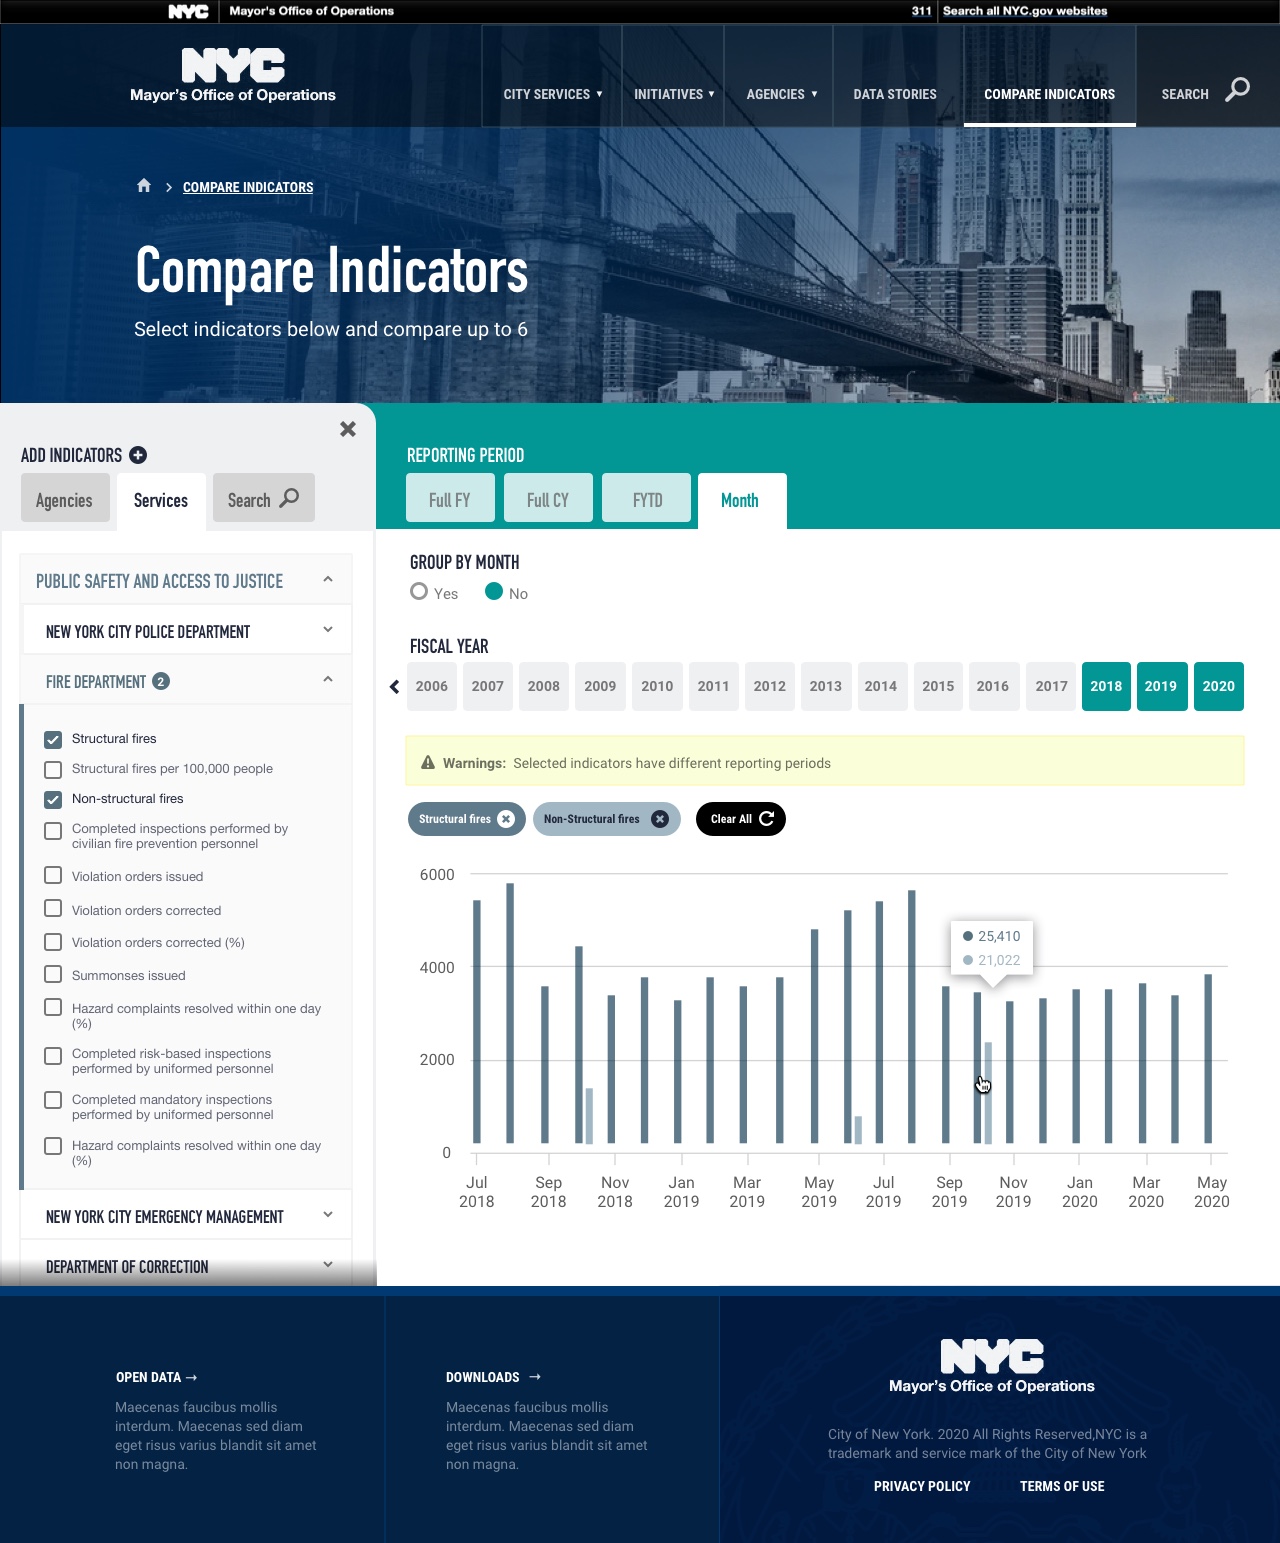
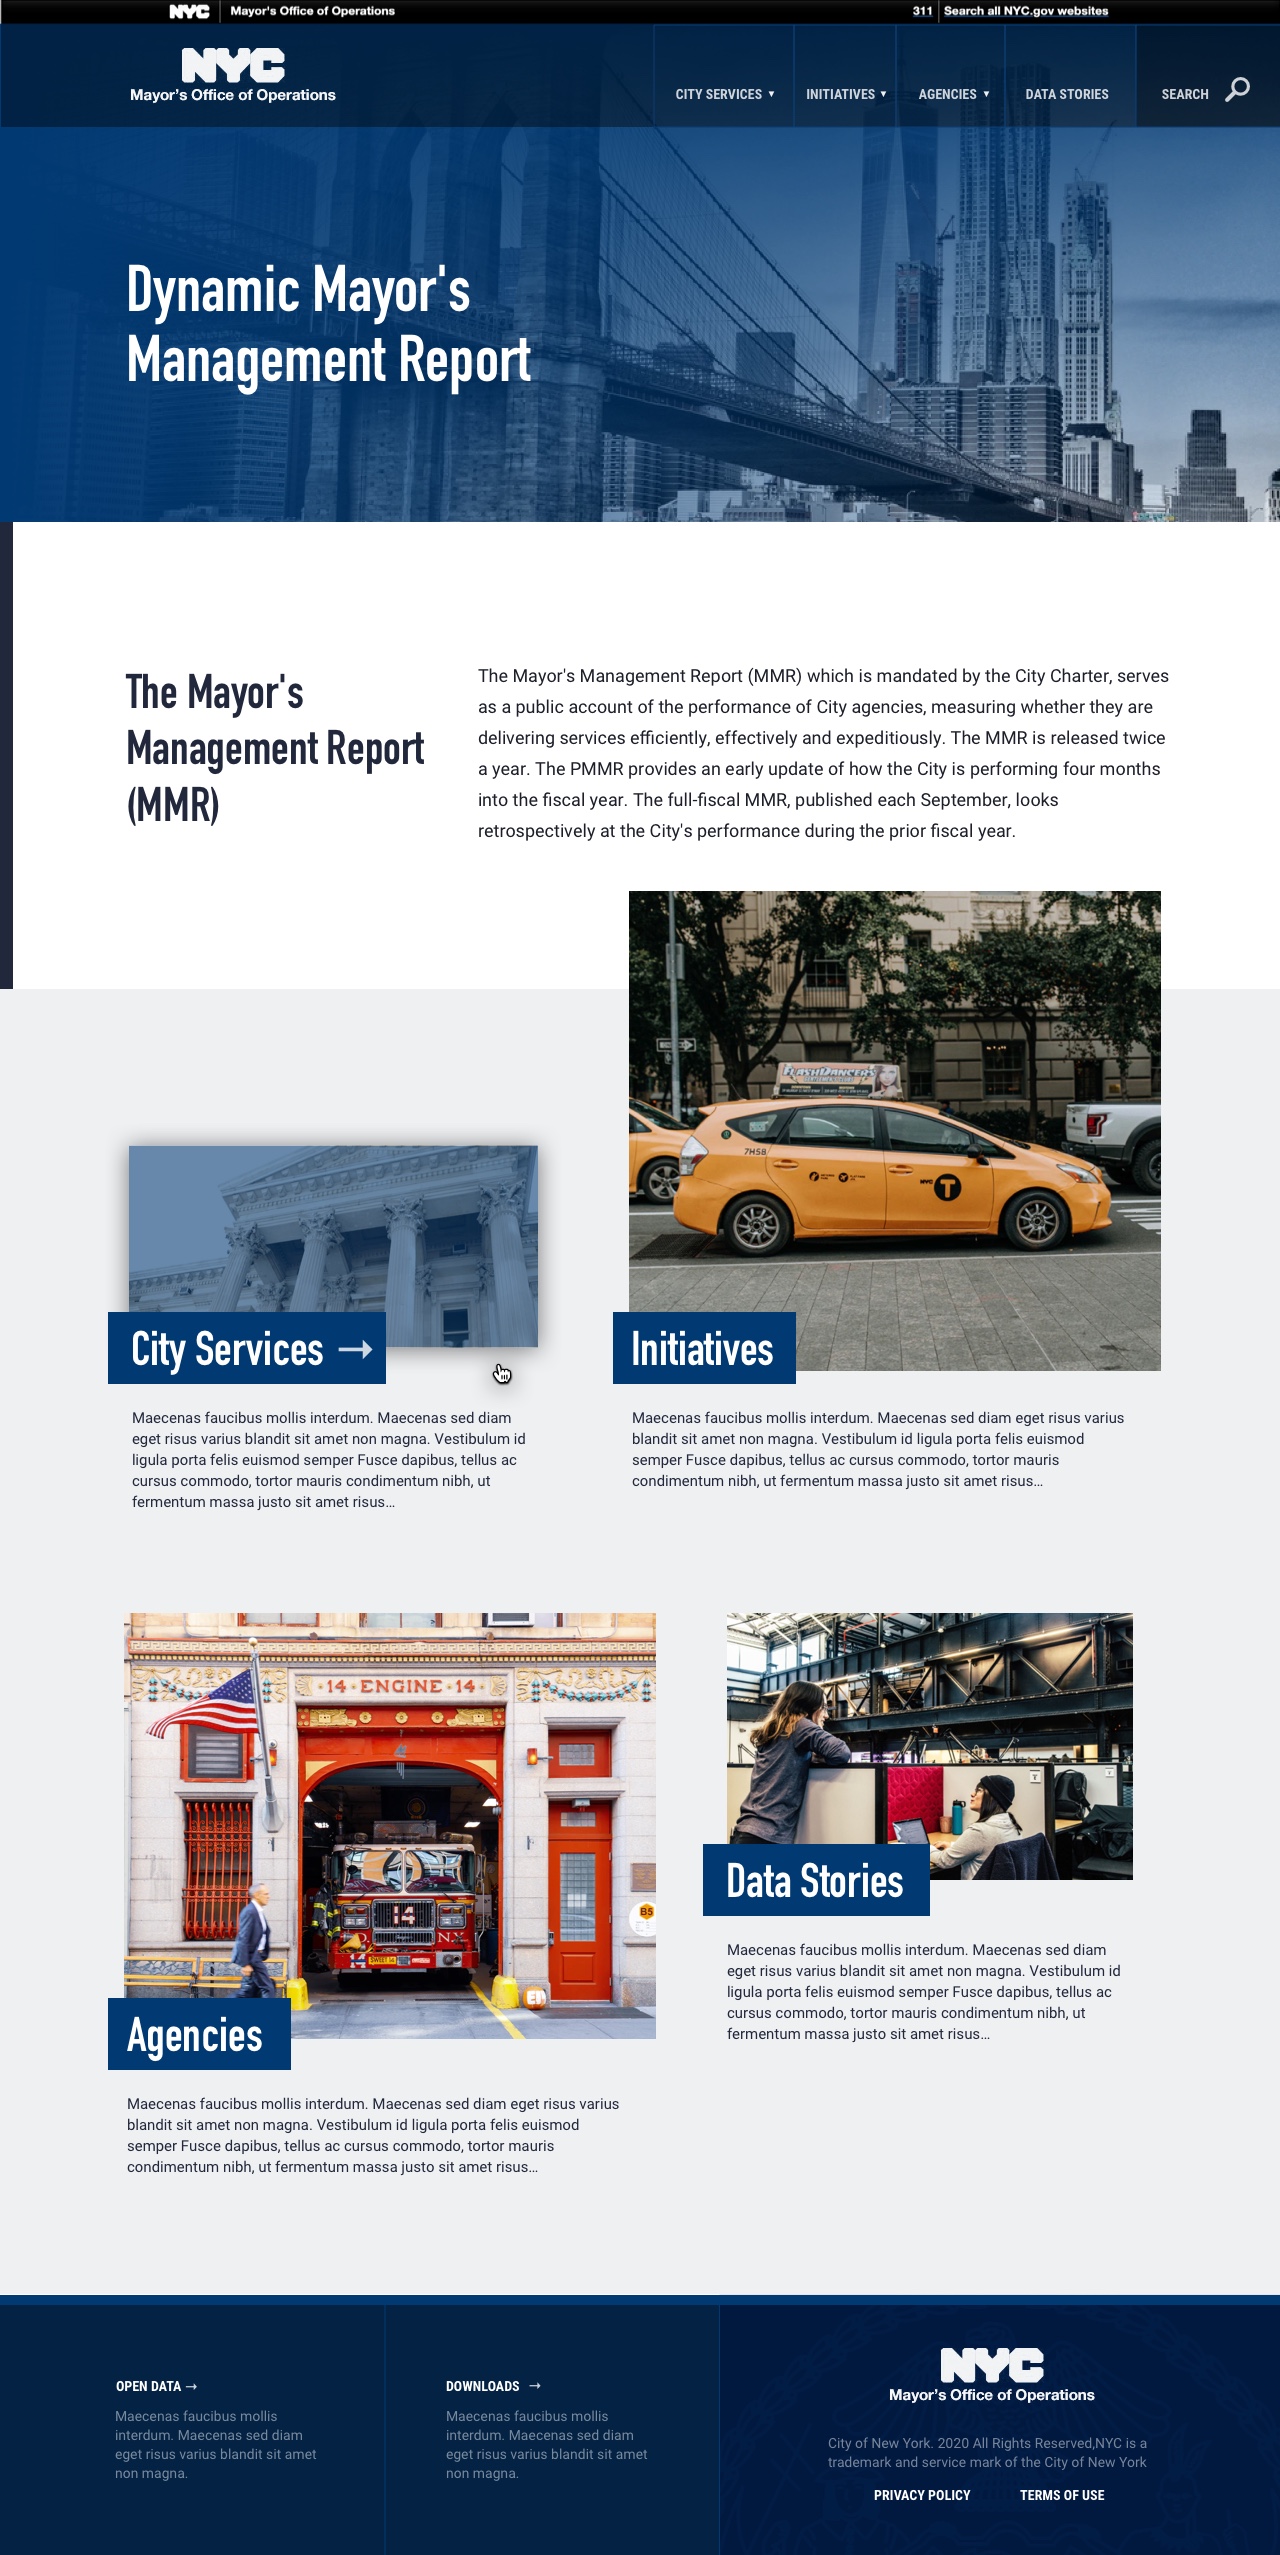
The Mayor’s Management Report is composed of hundreds of pages of data from each agency with descriptions on their achievements, goals and objectives. Transforming the data to be made available online was a task that required mental modeling and a new user interface of following targeted audiences:
We analyzed Ops team’s current workflows and gained an understanding of their prospective requirements, features, and user profiles.
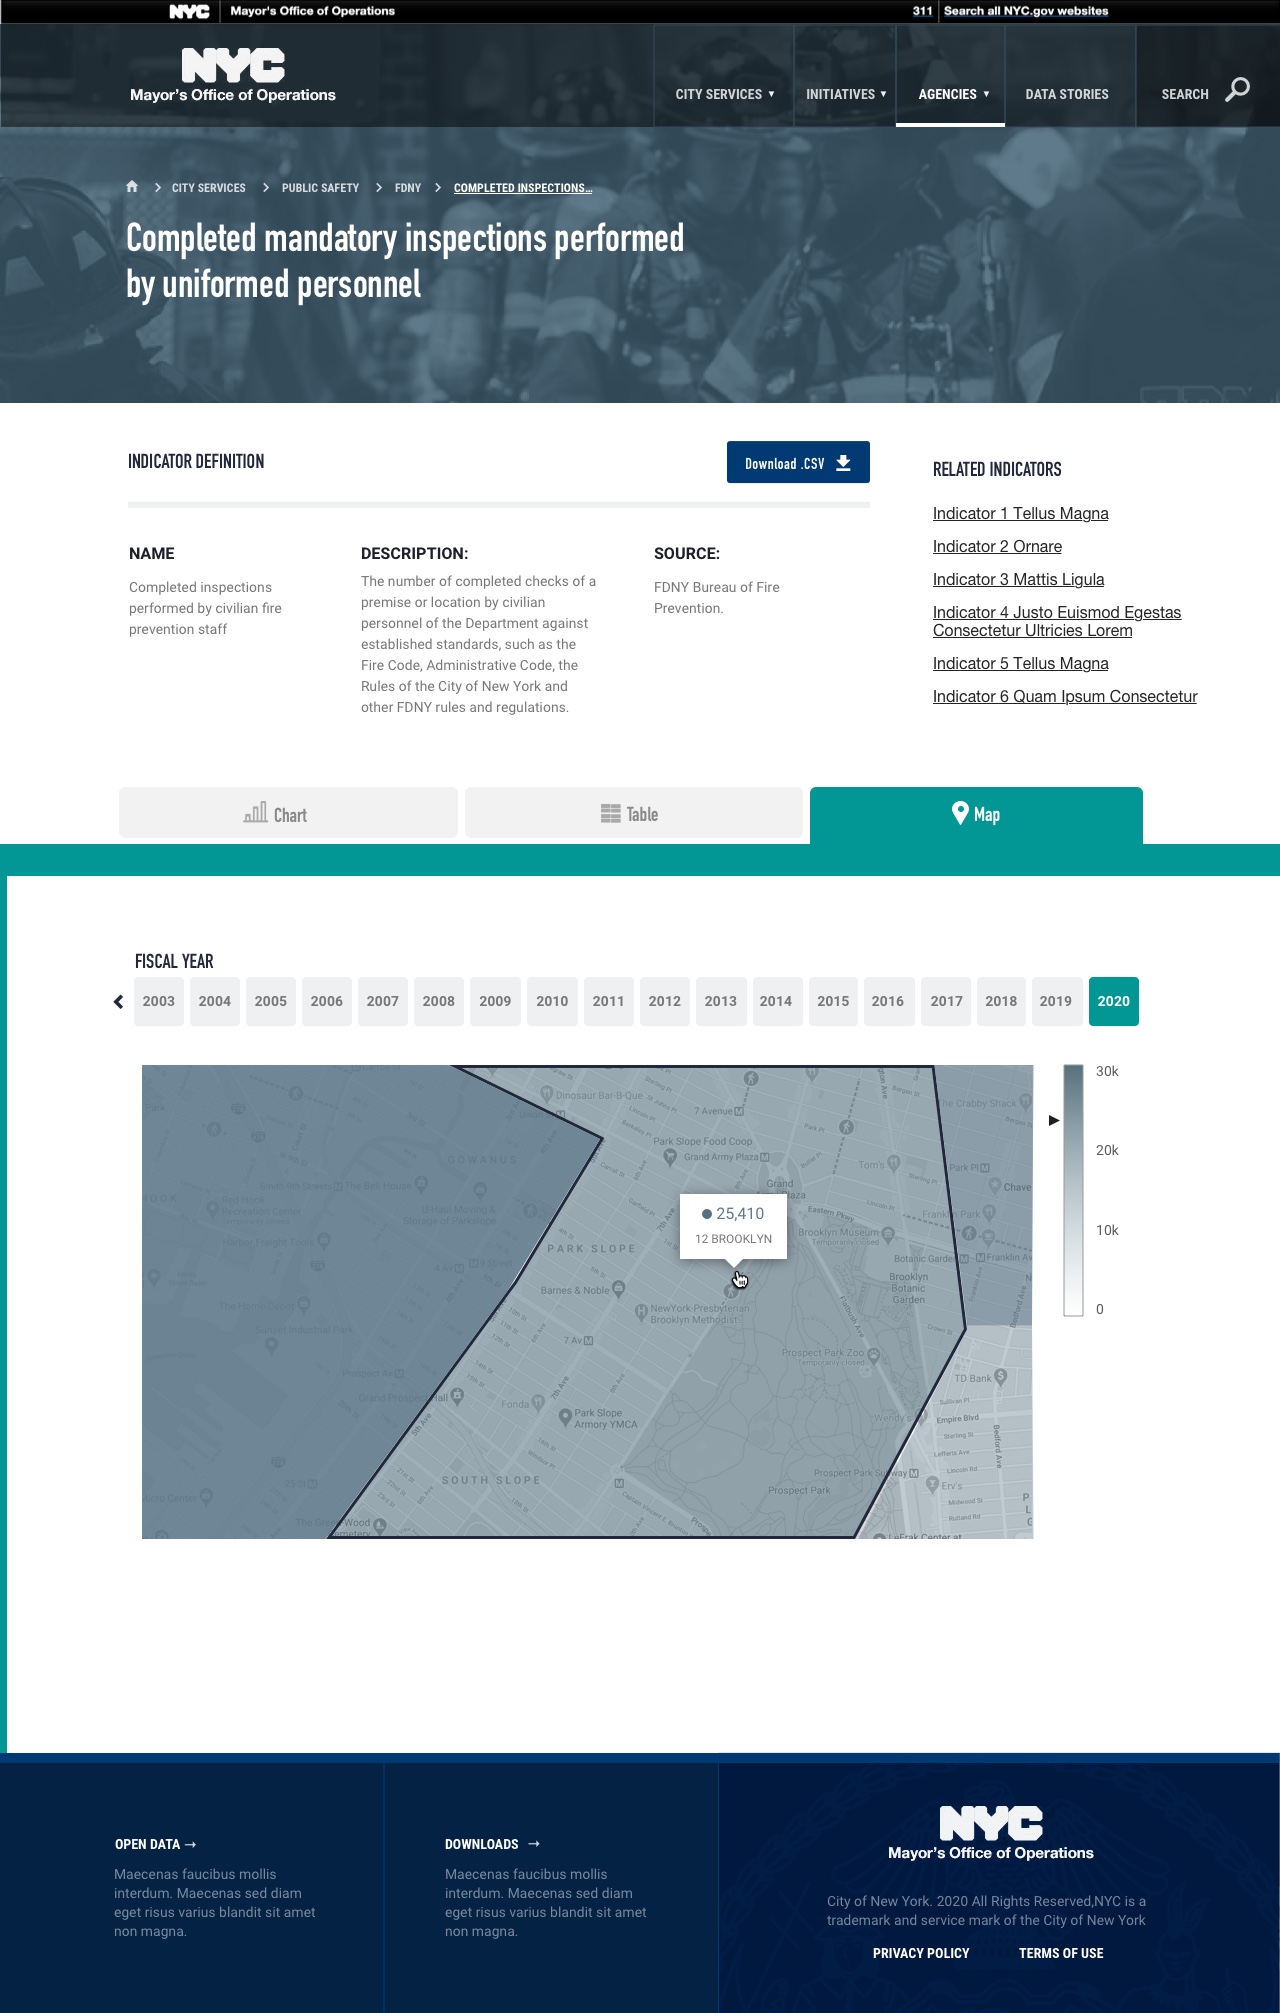
We implemented the capability in DMMR to represent the geographic characteristic of the KPIs using Choropleth (statistical thematic map). Users are able to view data from different years on the map and understand the performance of an Agency.
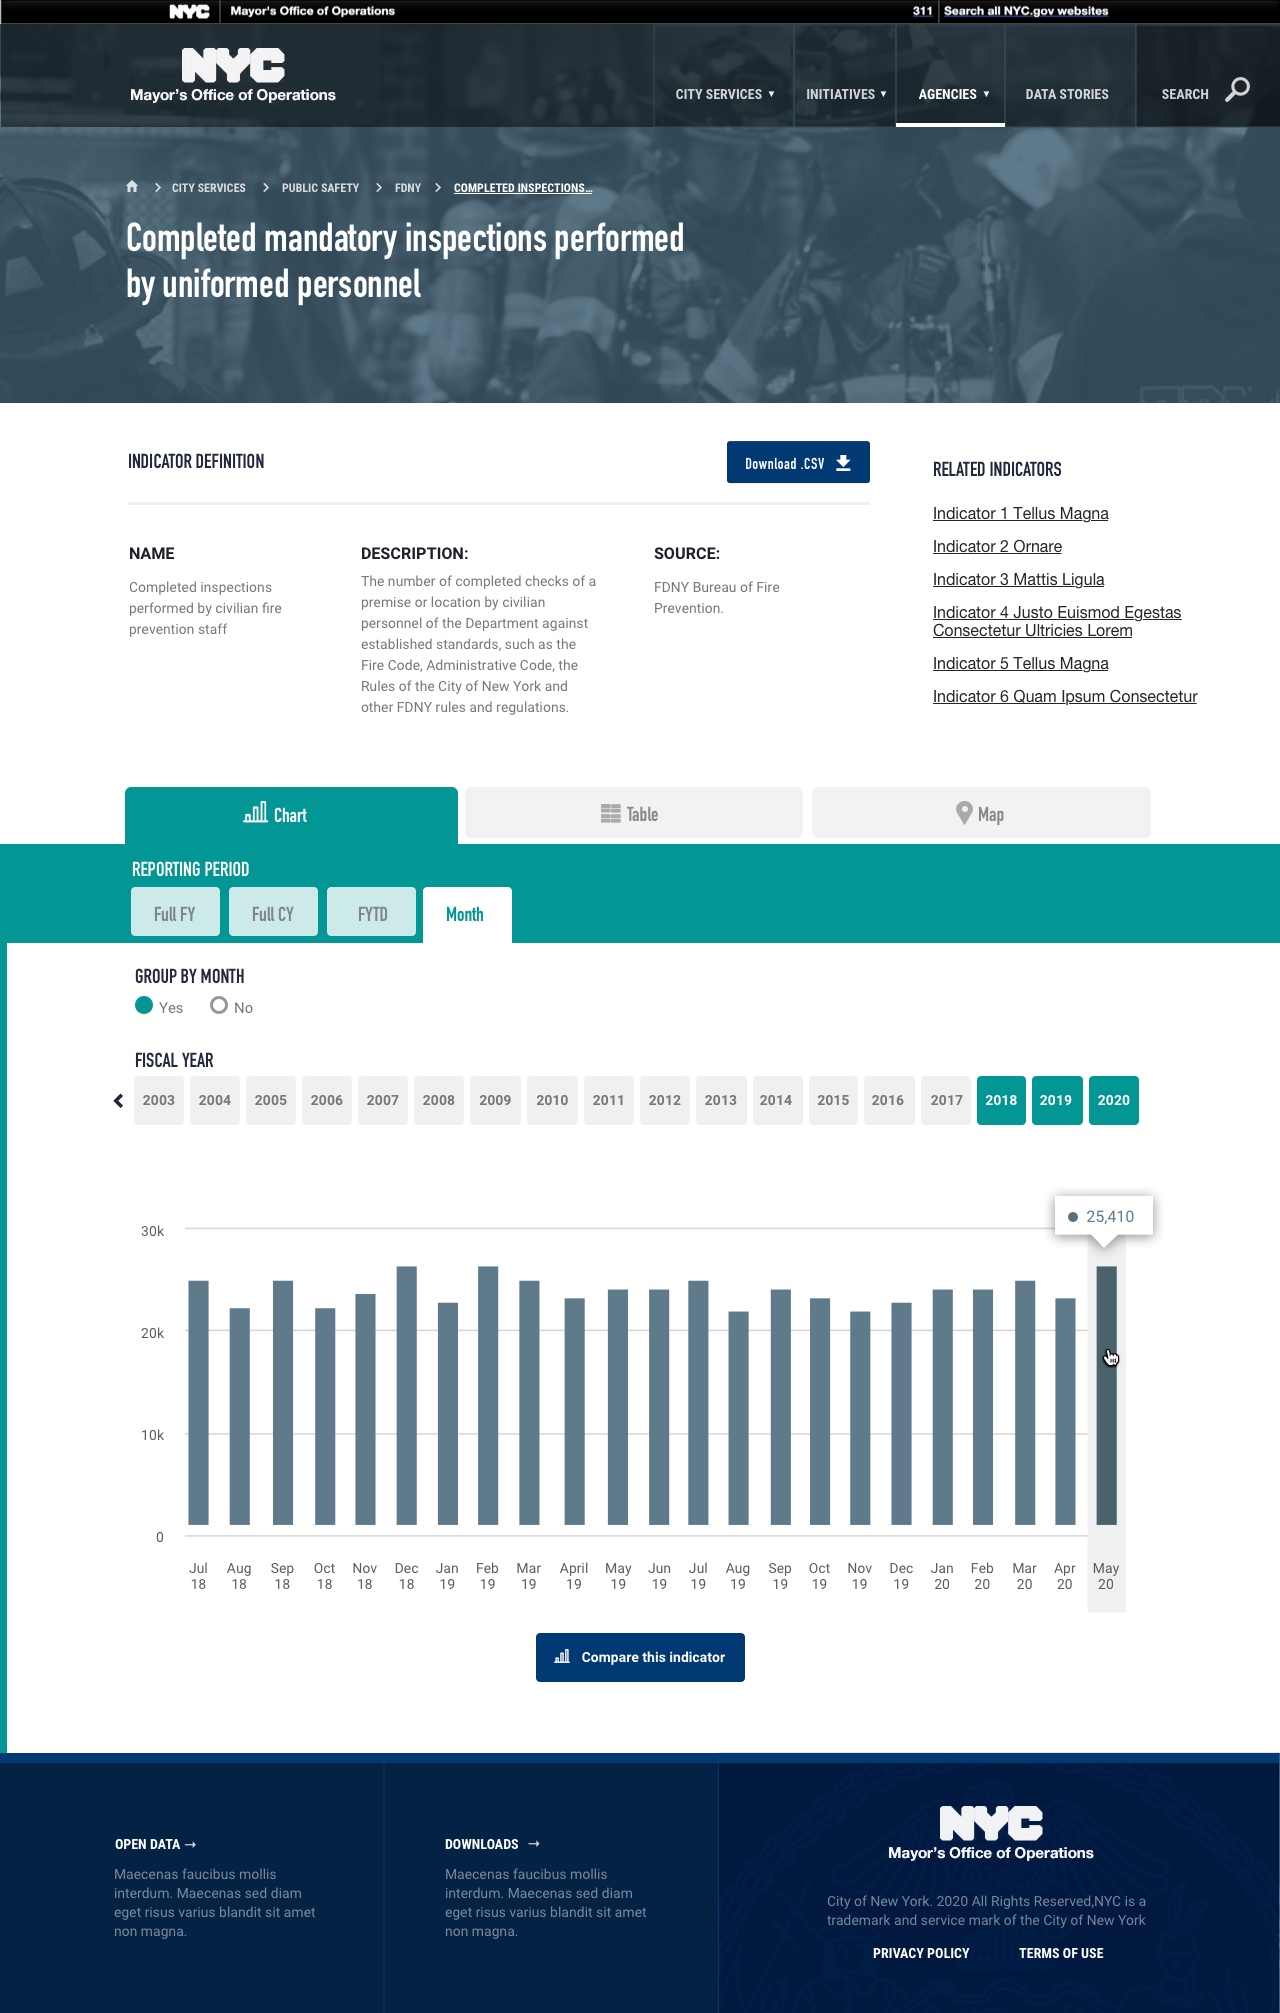
With the quantity of data that required to be stored as well as represented we implemented the system with the “Headless CMS” architecture to be available to the frontend in the form of REST or GQL API. The advantages include better data import and enrichment support, rapid design iterations and execution, enhanced security, tremendous SEO advantages, simpler deployments, easier third-party integrations.
DMMR is a platform that is evolving with the needs of Agencies, Ops team as well as the data that flows into it. We maintain the infrastructure, code and processes in a timely manner.
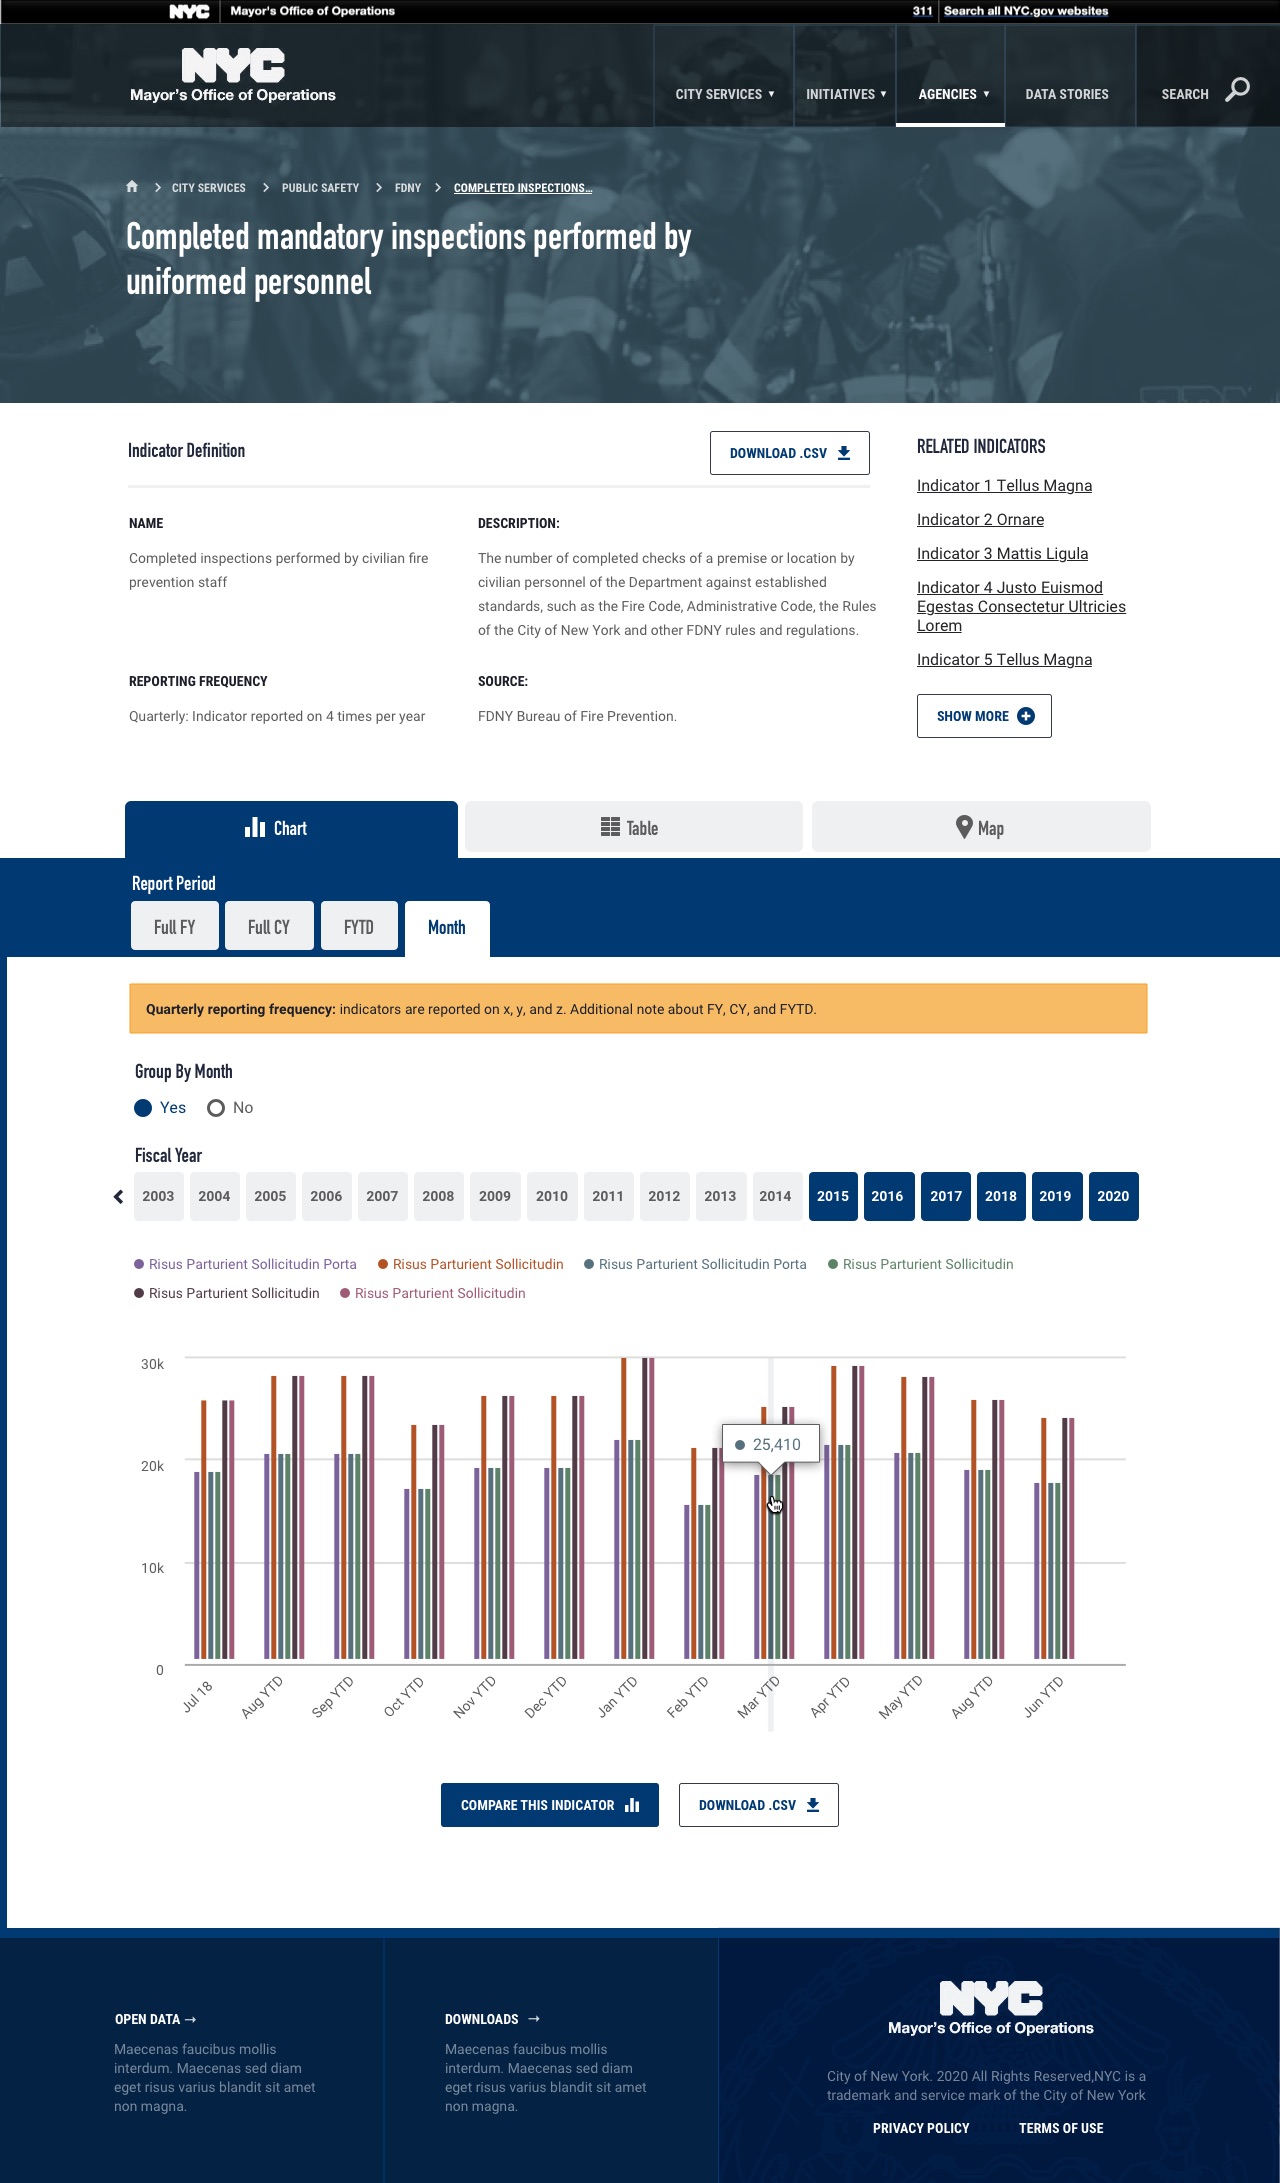
DMMR platform evolved to be a comprehensive platform to analyze performance indicators of Agencies that provided transparency, accountability, storytelling and visibility.
© 2026 HD MADE Inc. All Rights Reserved.